Count shapes in a Venn diagram
key notes:
What is a Venn Diagram?
- A Venn diagram uses circles to group things.
- Each circle shows a group (like red shapes or big shapes).
- The overlapping part shows shapes that belong to both groups.
🔺 Understanding Shapes in the Diagram
- Shapes can be:
- Circle 🔵
- Triangle 🔺
- Square ◼️
- Shapes may be sorted by:
- Color (red, blue, yellow)
- Size (big, small)
- Type (circle, square, triangle)
🔢 Counting Shapes
- Count shapes in each part:
- Left circle
- Right circle
- Middle (overlap)
- Count carefully one by one.
- Do not count the same shape twice.
🔁 Understanding the Overlap
- Shapes in the middle belong to both groups.
- Example: A big red circle can be in both “big” and “red”.
🧠 Key Skills Students Learn
- Sorting and grouping
- Counting objects
- Comparing sets
- Understanding “same” and “different”
🎯 Teaching Tips
- Use real objects or cut-out shapes ✂️
- Ask questions like:
- “How many shapes are only red?”
- “How many are both big and blue?”
- Let students color and count for fun learning 🎨
Learn with an example
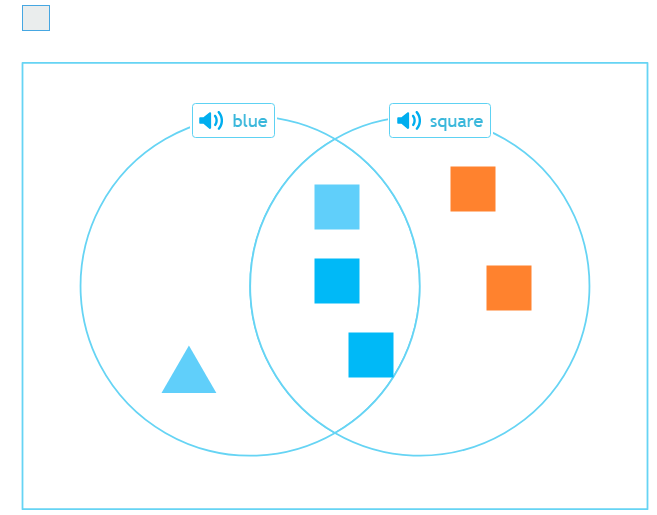
🍧How many shapes are blue?
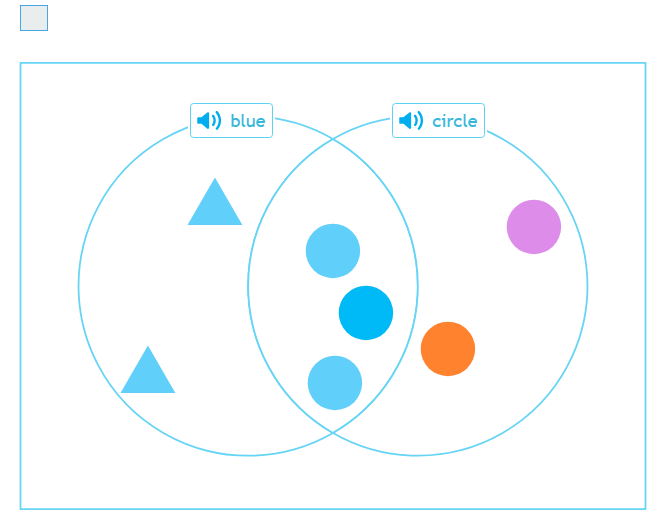
These are the blue shapes. They are in the section marked blue.
Count them.
- There are 5 blue shapes.
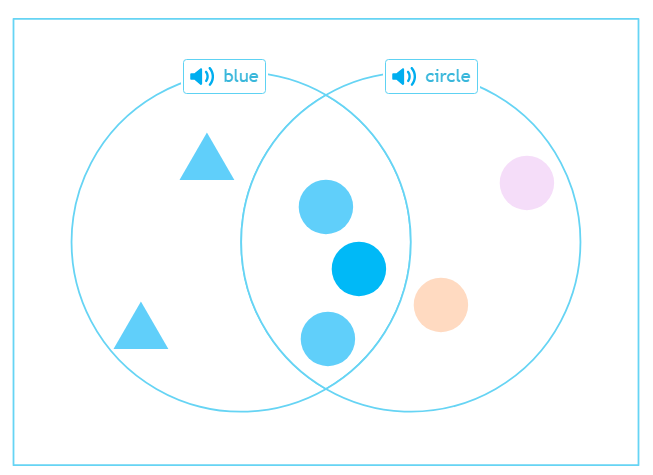
🍧How many shapes are blue?
These are the blue shapes. They are in the section marked blue.
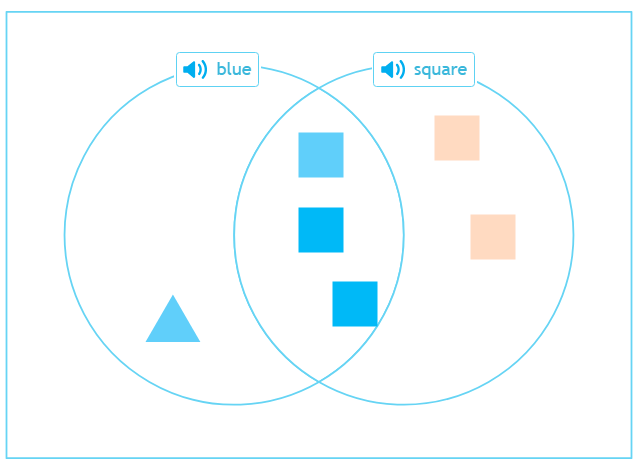
Count them.
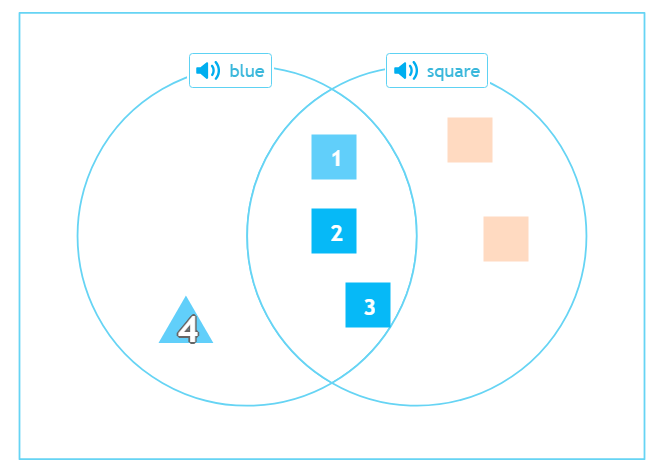
- There are 4 blue shapes.
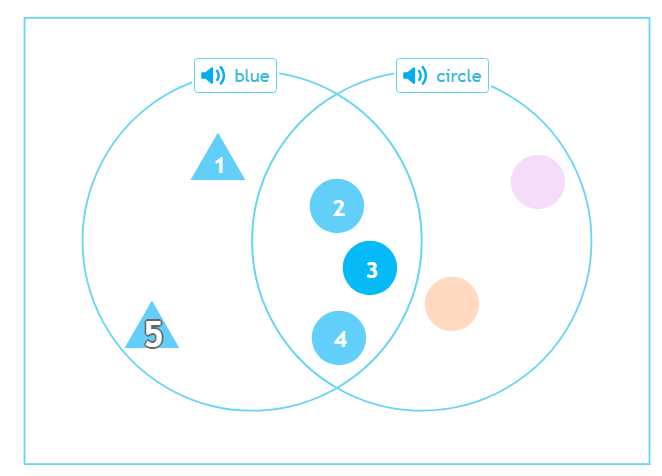
🍧How many shapes are orange?
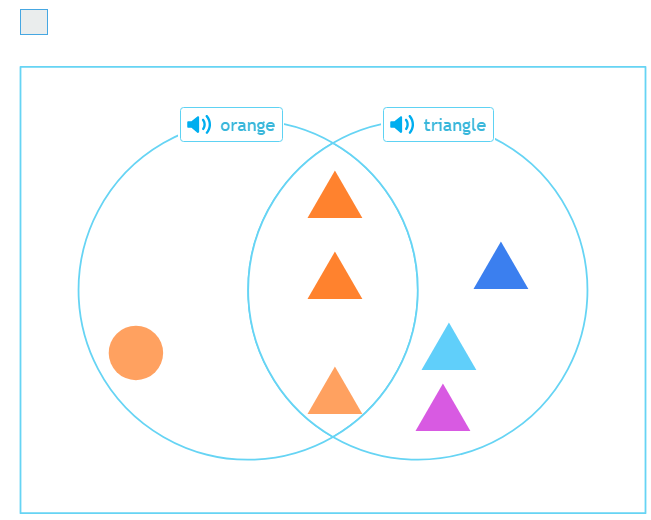
These are the orange shapes. They are in the section marked orange.
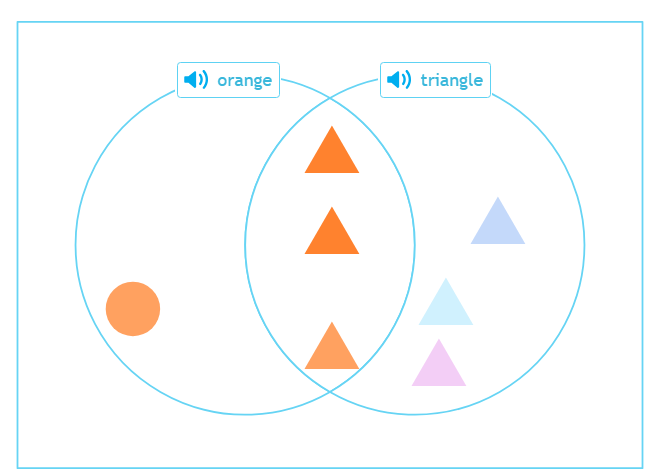
Count them.
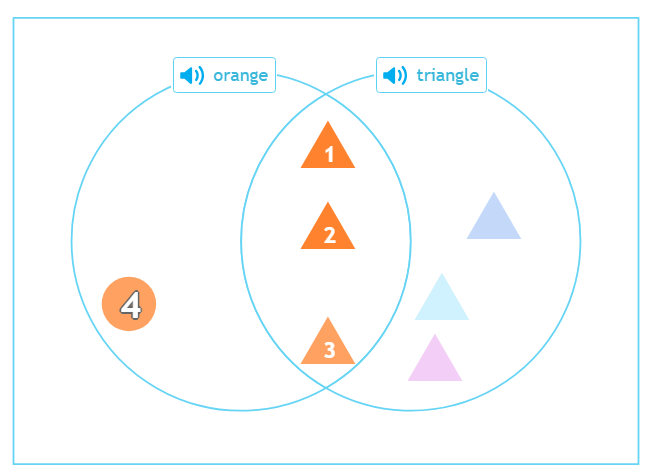
- There are 4 orange shapes.
Let’s practice!