Interpret tally charts
key notes
What is a Tally Chart?
- A tally chart is used to count and record numbers.
- It uses lines (tally marks) instead of numbers.
- Each line stands for 1.
✋ Understanding Tally Marks
- | = 1
- || = 2
- ||| = 3
- |||| = 4
- The 5th mark is drawn across the first four 👉 (like a group).
- So, every group of 5 helps us count faster.
🔢 How to Read a Tally Chart
- Count each group of 5 first, then add extra marks.
- Example:
- One group of 5 + 2 marks = 7
- Look at each row and say the total number.
🍎 Example for Kids
- Apples: |||| = 4
- Bananas: ||||| = 5
- Grapes: ||| = 3
👉 Bananas are more, grapes are less.
❓ Questions Students Can Answer
- Which has the most?
- Which has the least?
- How many are there in total?
- How many more/less?
🎯 Teaching Tips
- Use real objects (fruits, toys) to make tally marks.
- Encourage skip counting by 5.
- Practice with fun worksheets and pictures.
Learn with an example
Keith brought some drinks to the beach. This tally chart shows how many of each type of drink he brought.
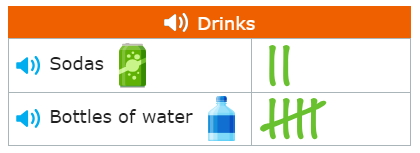
🖊️Which drink did Keith bring fewer of?
Count the tally marks for each type of drink.

Keith brought these drinks:
2 sodas
5 bottles of water
2 is less than 5.
Keith brought fewer sodas.
Grace put fruit in a smoothie. This tally chart shows how many of each type of fruit she used.
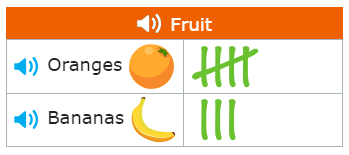
🖊️Which fruit did Grace use fewer of?
Count the tally marks for each type of fruit.
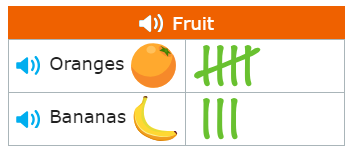
Grace used this fruit:
5 oranges
3 bananas
3 is less than 5.
Grace used fewer bananas.
Nell fed her pony some snacks. This tally chart shows how many of each type of snack her pony got.
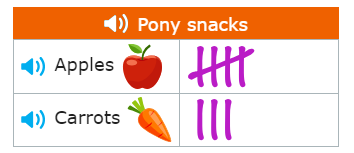
🖊️How many more apples than carrots did the pony get?________
Count the tally marks for apples and carrots.
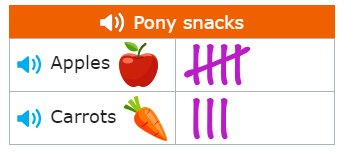
Nell’s pony got these snacks:
5 apples
3 carrots
Subtract to find the difference.
5–3=2
The pony got 2 more apples than carrots.
Let’s practice!