Interpret picture graphs
key notes
What is a Picture Graph?
- A picture graph (pictograph) uses pictures or symbols to show information.
- Each picture stands for a number of objects.
🔍 Parts of a Picture Graph
- Title – tells what the graph is about
- Pictures/Symbols – represent items
- Labels – tell what each row means
- Key (Legend) – shows what one picture stands for (e.g., 🍎 = 2 apples)
👀 How to Interpret (Read) a Picture Graph
- Look at the title to know the topic
- Read the labels on the side
- Check the key to understand each picture
- Count the pictures carefully
- Multiply if needed (e.g., 1 picture = 2 items)
🤔 Questions Students Can Answer
- Which has the most?
- Which has the least?
- How many are there in total?
- How many more or fewer?
🧠 Important Tips
- Count one by one carefully
- Do not forget to use the key
- Compare groups by looking at the number of pictures
🎯 Simple Example
If 🍌 = 1 fruit
Bananas: 🍌🍌🍌 → 3 bananas
If 🍎 = 2 fruits
Apples: 🍎🍎 → 4 apples
🎉 Fun Activity
- Ask students to draw a pictograph of their favorite fruits or toys
- Let them use simple symbols like ⭐ or 🍭
Learn with an example
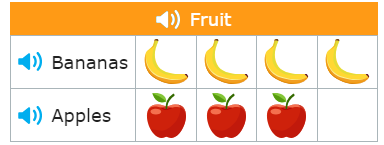
James shared some fruit at his soccer game. This pictograph shows how many of each fruit he shared.
🏫How many pieces of fruit did James share in all?
_______pieces of fruit
Count each type of fruit in the pictograph.
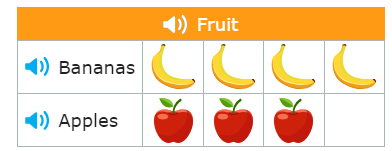
- James shared this fruit:
- 4 bananas
- 3 apples
- Add to find the total number of pieces of fruit.
- 4+3=7
- James shared 7 pieces of fruit in all.
Lucas bought some food for his pet rabbit. This pictograph shows how many of each food he bought.
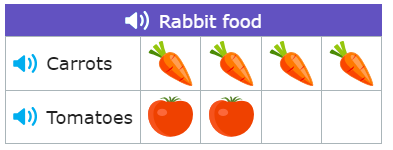
🏫How many carrots did Lucas buy?
________carrots
Count the carrots in the pictograph.
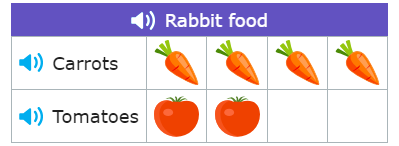
- There are 4 carrots. Lucas bought 4 carrots.
Willow asked some friends what they had for breakfast. Willow made a pictograph of the results.
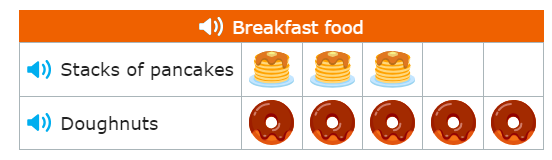
🏫Which food did fewer people eat?
- stacks of pancakes
- doughnuts
Count each type of breakfast food in the pictograph.
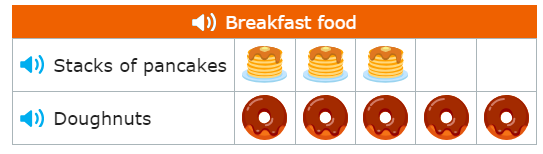
- Willow’s friends ate this food:
- 3 friends ate pancakes
- 5 friends ate doughnuts
- 3 is less than 5.
- Fewer people ate pancakes.
Let’s practice!